
What the shop took over a period. Set From and To and press Run; it defaults to this month so far.
The summary
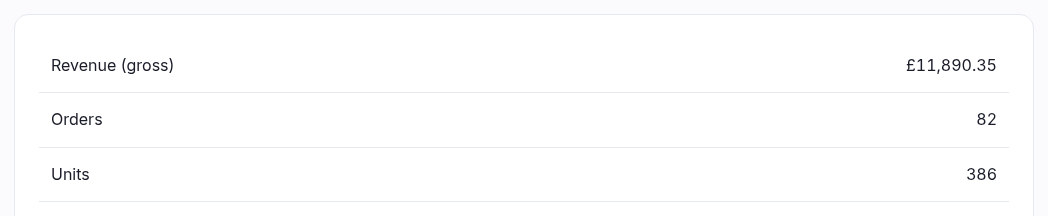
| Figure | Means |
|---|---|
| Revenue (gross) | The total of every paid order in the range, VAT included. |
| Orders / Units | How many orders, and how many individual items across them. |
| Discounts | How much discount codes took off. |
| VAT | The tax contained in that revenue. |
| Refunds | Money given back in the range. |
| Net revenue | Revenue minus refunds — the number that matters. |
| Margin | Only with Cost tracking: revenue minus what the stock cost you. |
VAT — which case are you?
- If you are VAT registered (a VAT number is saved in Settings ▸ Store details): your prices are treated as VAT-inclusive, and the VAT contained in each sale is broken out here. That's the figure your return needs.
- If you are not VAT registered: no VAT is charged or recorded, and these figures stay at zero. That's correct, not a fault — leave the VAT number blank until you register, and the shop simply won't add tax.
The charts and the table
Two graphs — revenue per day and orders per day — sit above a day-by-day table. They're deliberately separate charts rather than one with two scales, because money and a count can't share an axis honestly. Days with no sales show as zero, not as a gap, so a quiet week looks quiet rather than invisible. Ask for more than a year and it switches to monthly buckets.
Top products ranks what sold by revenue, with units alongside.
Email me this report
Sends the summary for the range you're looking at to your own address — handy for a weekly figure without logging in. It emails exactly what's on screen.
Good to know
Days are bucketed in your timezone (Settings), so a late-evening sale lands on the right day. Only paid orders count — a pending order is not revenue.