
Who is visiting the storefront, where they came from and what they looked for. Needs the Shop analytics feature. Bots are excluded from every figure.
The headline figures
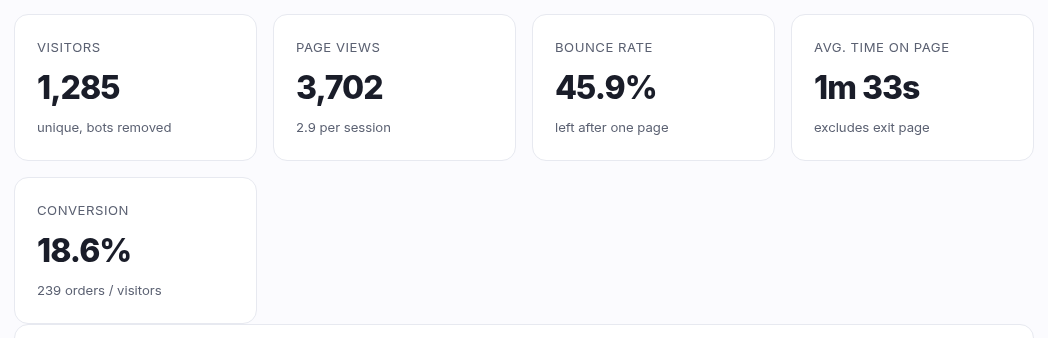
| Figure | Means |
|---|---|
| Visitors | Distinct people, counted per day. |
| Page views | Pages looked at, with the average per visit alongside. |
| Bounce rate | The share of visits that ended after a single page. |
| Avg. time on page | How long a page was read. The last page of a visit is excluded, because there's no way to know when someone left — counting it as zero is what makes most analytics under-report this. |
| Conversion | Paid orders divided by visitors — the number that joins this report to the funnel. |
The panels
- Visitors & page views — the daily trend.
- Channels — Direct, Search, Social or Referral.
- Devices — desktop, mobile, tablet.
- Top pages — what gets looked at most.
- Top products — most-viewed products with units sold beside them. A product high on views and low on sales is usually priced wrong or badly photographed; this is the panel that finds it.
- Referrers and Campaigns — which sites send traffic, and
any link you tagged with
utm_campaign. Tag a Facebook post or a newsletter link and you can measure it here. - Top searches and Searches with no results — what people typed into your search box. The no-results list is the clearest "what should I stock next" signal you will ever get.
Privacy
Counting is done on our side with no cookie and no tracking script. A visitor is stored only as a scrambled code that is thrown away and regenerated daily — no IP address and no browser fingerprint is ever kept. That's why this needs no cookie banner.
Good to know
Page, referrer, product and search detail covers roughly the last 90 days. The visitor and page-view totals are kept indefinitely, so the long-term trend survives.